
Consultancy delivered through
an engineering platform.
Sanova does not hand over slide decks assembled by hand. Every assessment is captured, calculated and reviewed inside our own engineering platform — so findings are traceable, repeatable and auditable.
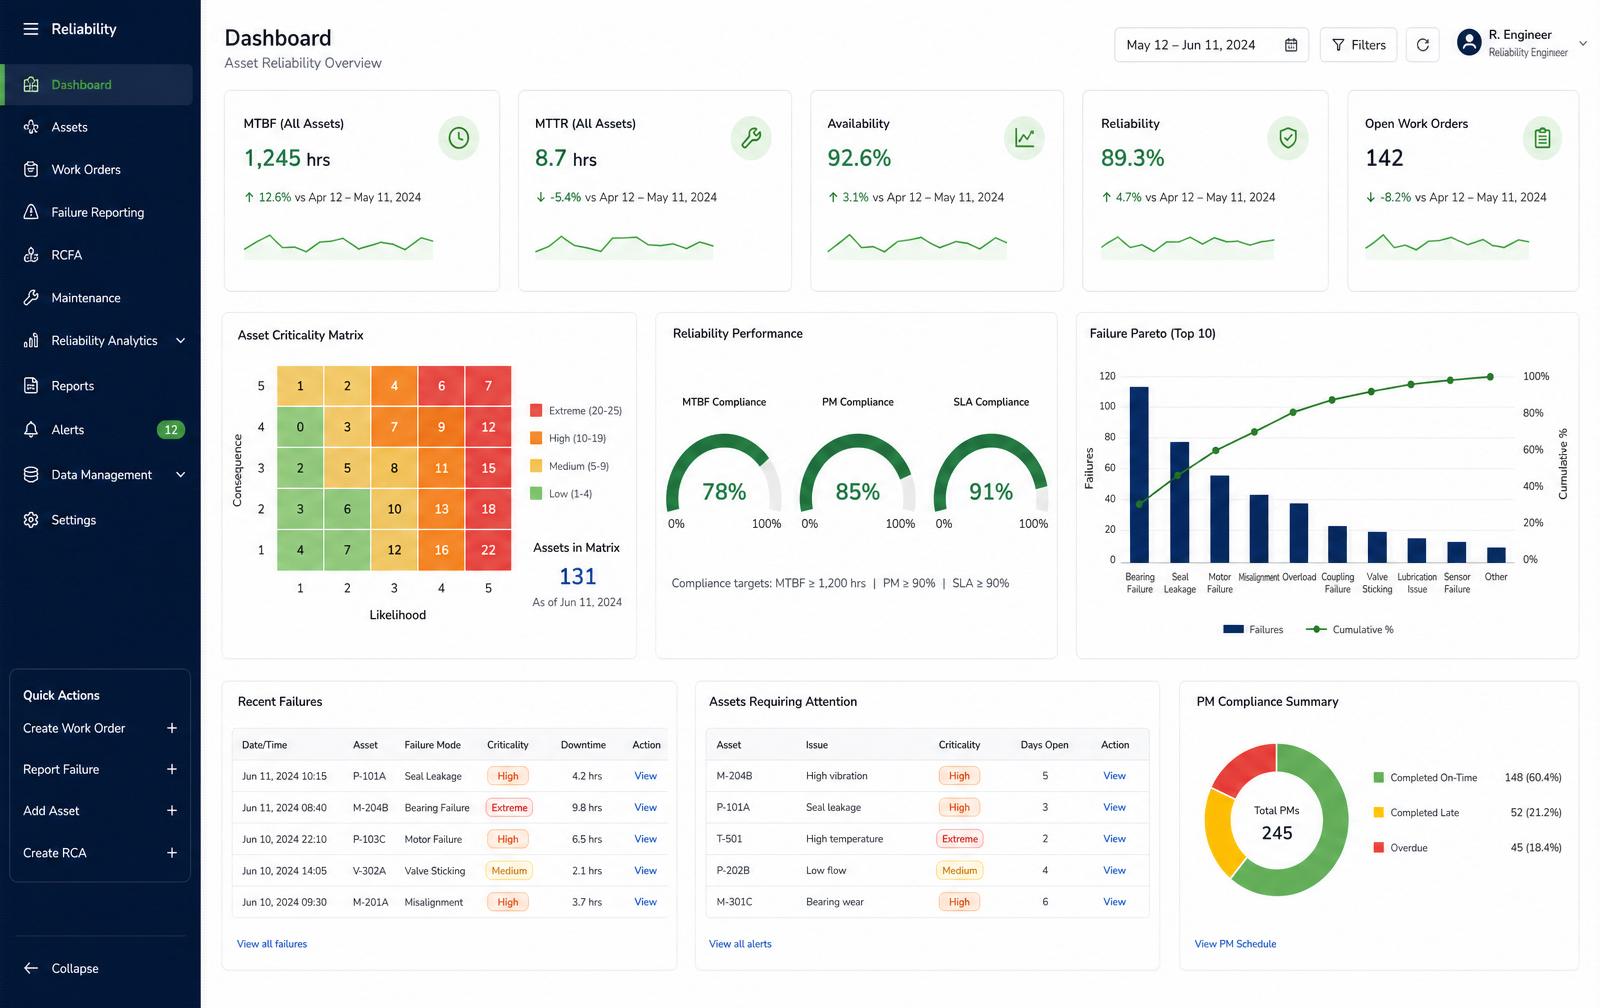
Representative reliability dashboard generated from assessment data.
What the platform captures.
Asset library
Industry → category → equipment → component → subcomponent hierarchy with failure modes and tasks.
Field measurements
Vibration, thermal, ultrasonic, oil, thickness and alignment readings with limits, status and trends.
Annotated site photos
Field photography with arrows, callouts, notes and before/after comparison.
Engineering calculations
Heat exchanger fouling, pump NPSH, generator load, MTBF, MTTR and availability models.
Dashboards
Criticality matrices, reliability gauges, Pareto analysis and KPI dashboards from live assessment data.
AI engineering assistant
Draft observations from your own project data, with confidence scoring and mandatory engineer review.
Report builder
Twenty-plus editable sections, document control, revisions and a locked PDF export.
Approval gating
Prepared, reviewed and approved stages must be completed by named engineers before a report can be issued.
Reports you can defend in an audit.
- Traceable evidence
Every recommendation links back to a measurement, a photograph or a documented failure event.
- Standards references
Findings cite ISO, API, ASME, EN and SMRP references — never invented sources.
- Controlled revisions
Document ID, revision number and named prepared / reviewed / approved signatories on every issue.
- Reusable baseline
Your assessment data stays structured, so the next survey compares directly against the last.
See it applied to your plant.
We'll walk you through an anonymised assessment report and show exactly what you'd receive at the end of an engagement.